Nxus User Manual
Version: 2.51.1 Example instrument: varies by feature (TSLA, AAPL, MSFT, GOOGL, NVDA)
This manual documents Nxus with reviewed product screenshots.
1. Overview
Nxus is an authenticated trading-analysis terminal. The default workspace is 1h interval and 1M timeframe. This manual uses different example symbols to showcase specific features: TSLA for terminal overview and AI chat, AAPL for volume analysis, MSFT for Bollinger Bands, GOOGL for Supertrend, NVDA for RSI/MACD indicators, and the Signals page for buy/sell signal performance.
2. Signing in
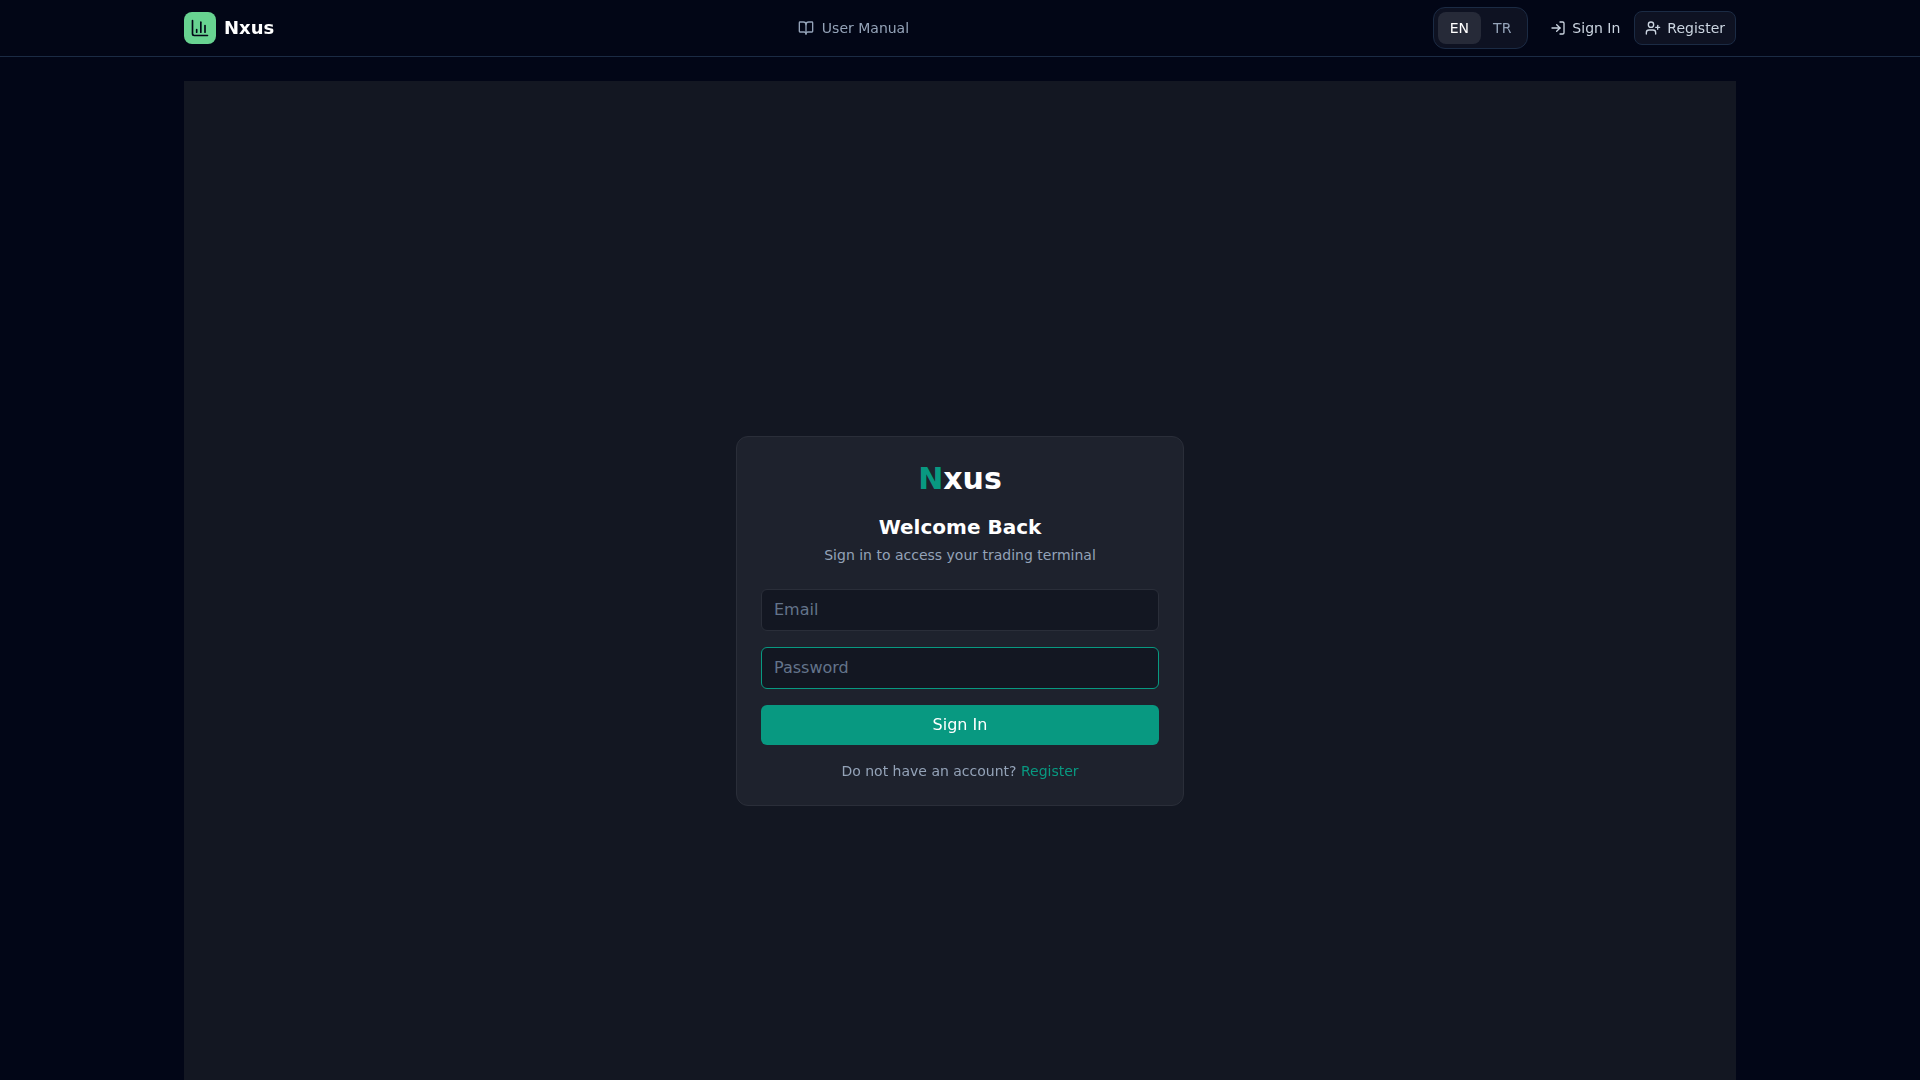
Sign in with an approved account. Admin and AI-enabled users can access all product areas, including AI-assisted analysis. Never share passwords, API keys, or tokens.
3. Main navigation
The application navbar links to Terminal, Scanner, Watchlists, Saved, Signals, Backtest, Portfolio, Alerts, User Manual, and Settings. The manual now uses the normal app layout, so only one live navbar is shown.
4. Terminal
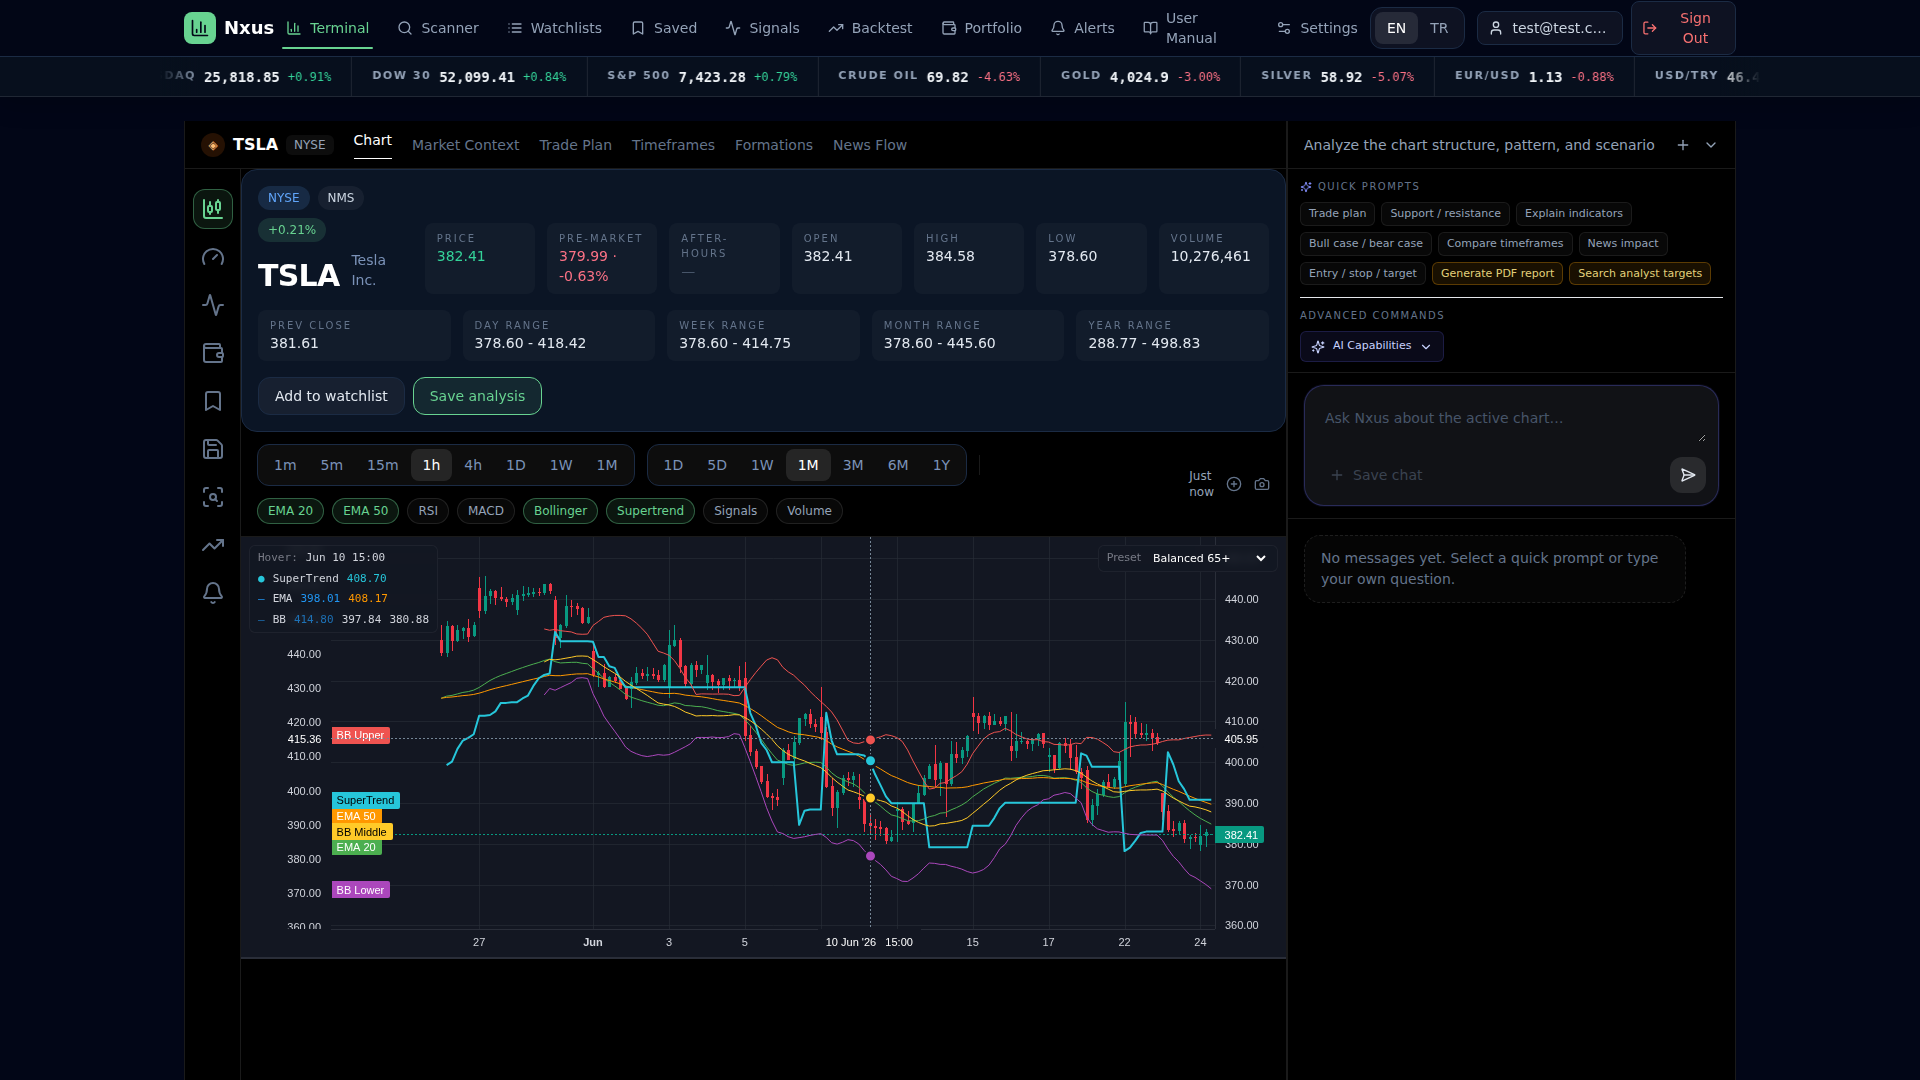
Terminal is the starting point. Search for TSLA or press the TSLA quick button to open the symbol workspace.
The symbol workspace includes Chart, Market Context, Trade Plan, Timeframes, Formations, News Flow, Notifications, Fundamentals, and Corporate Events. News headlines still open AI analysis when selected; use **Read source** to open the publisher in a separate tab. Notifications combines relevant news and dated company events, with Today, This week, This month, and This year filters. For BIST stocks it includes public KAP disclosures and their source details.
5. Working with symbols
The Nxus workspace opens with symbol quote data, chart tabs, timeframe/range controls, indicator toggles, and the AI analysis panel. The manual uses different example symbols to demonstrate specific features: TSLA for terminal overview and AI chat, AAPL for volume analysis, MSFT for Bollinger Bands, GOOGL for Supertrend, and NVDA for RSI/MACD indicators. Use these examples when comparing chart, signal, AI, and backtest workflows.
6. Charts and timeframes
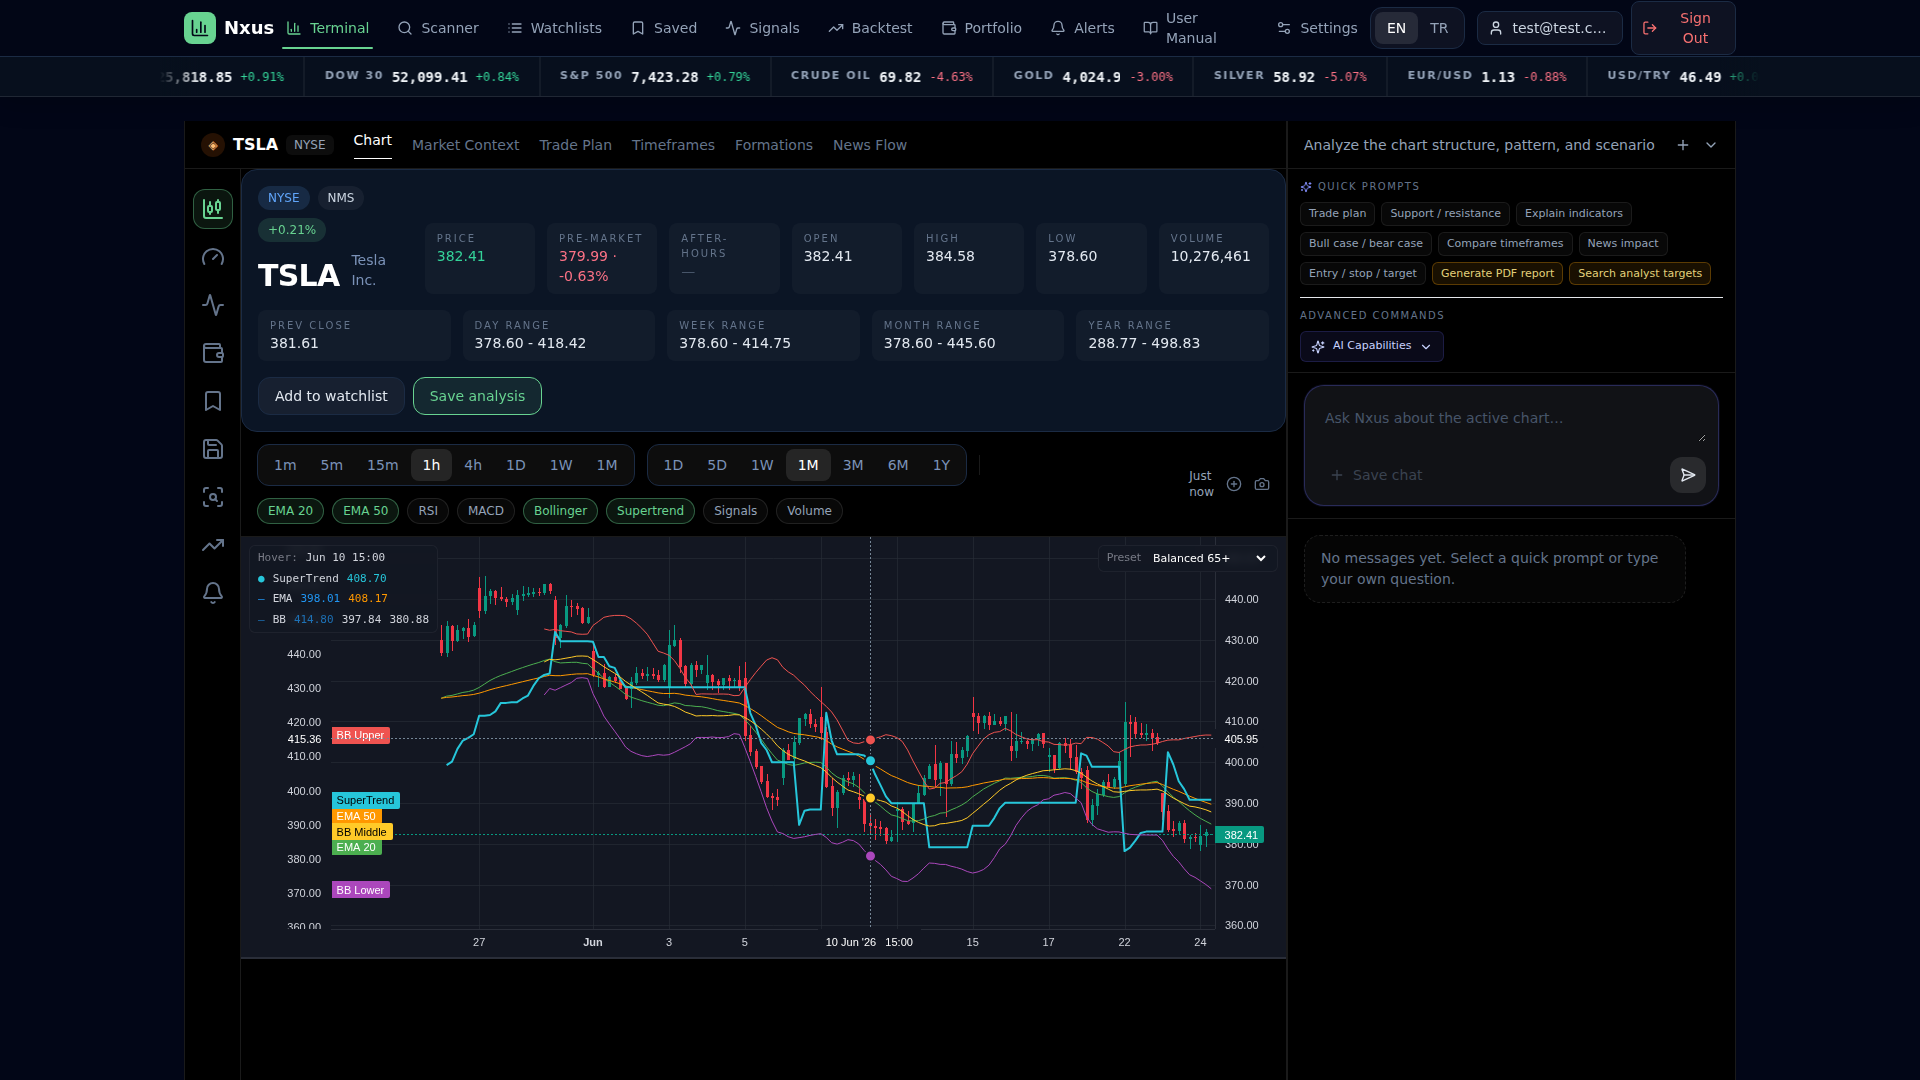
The chart endpoint is protected by authentication and returns candles, indicators, patterns, market context, news, and multi-timeframe data.
7. Indicators and chart tools
The workspace shows interval buttons, range buttons, EMA 20, EMA 50, RSI, MACD, Bollinger, Supertrend, Signals, and Volume controls.
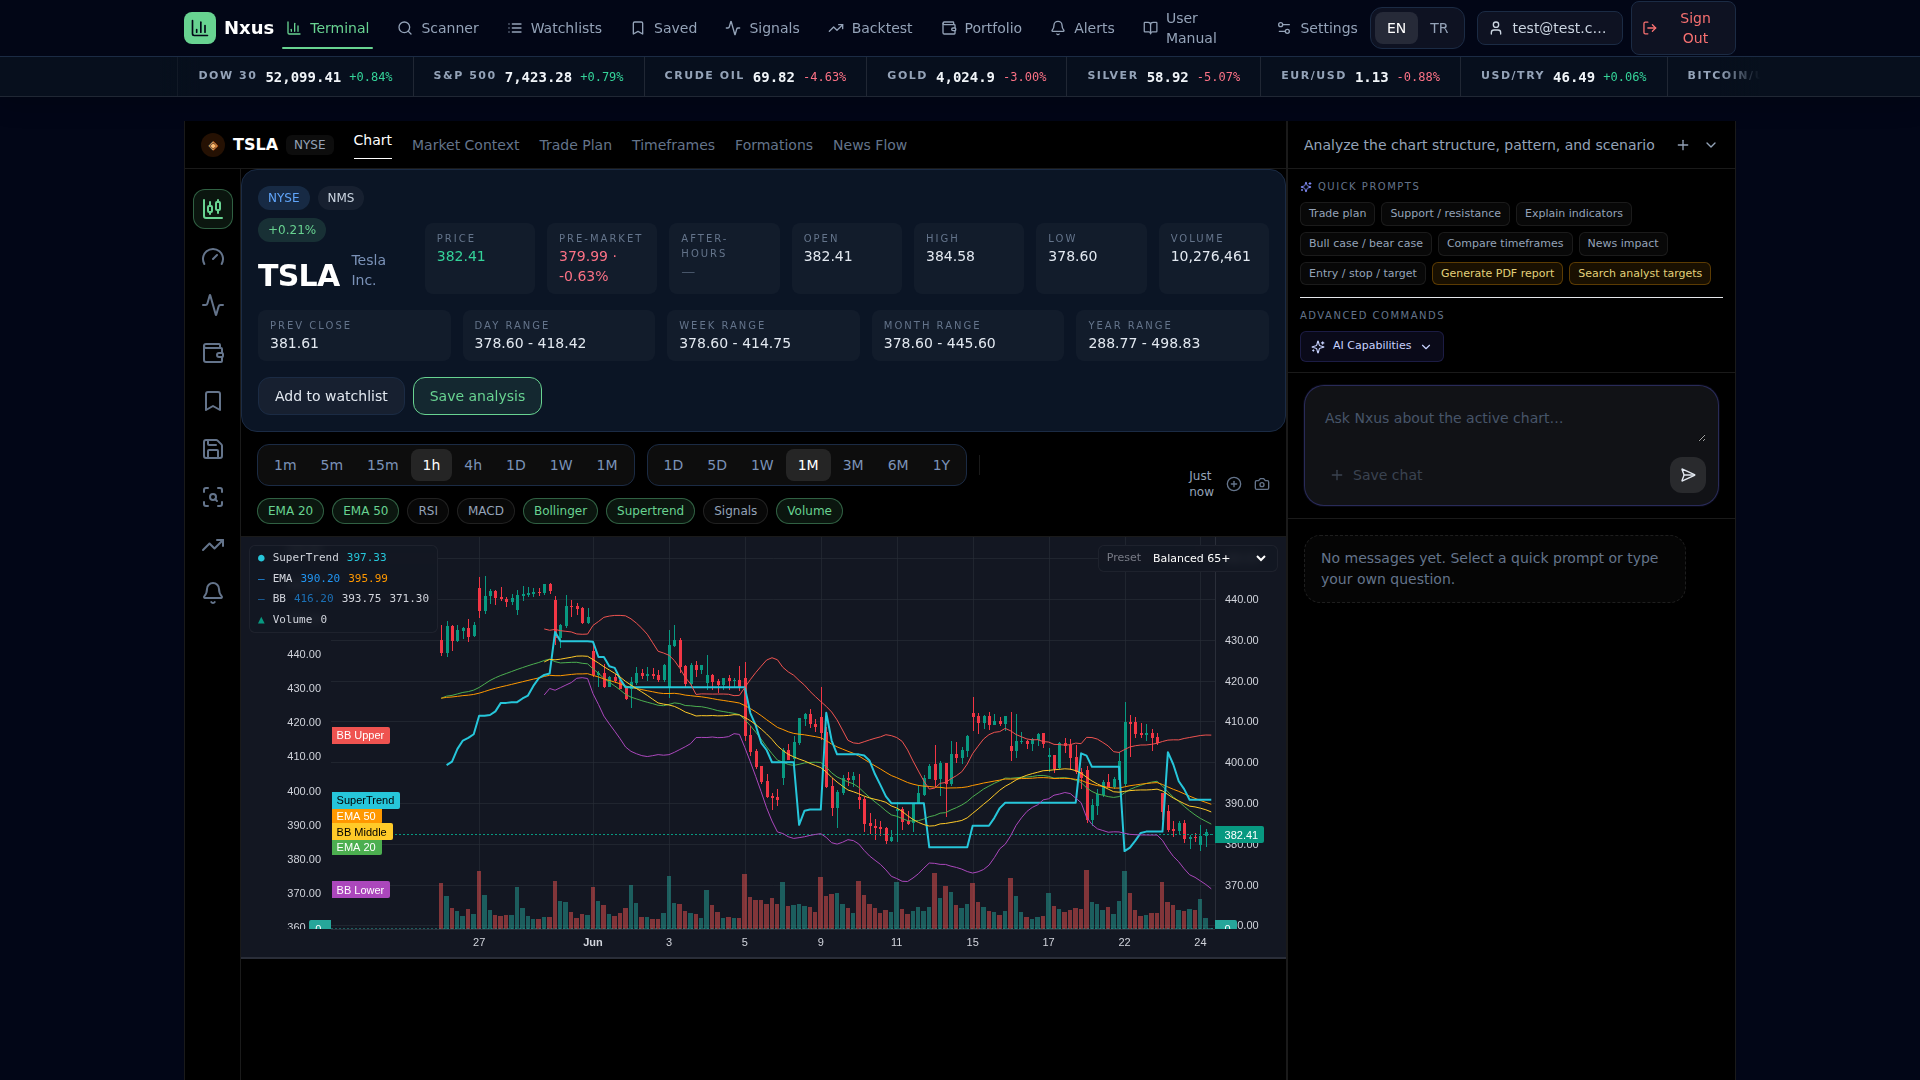
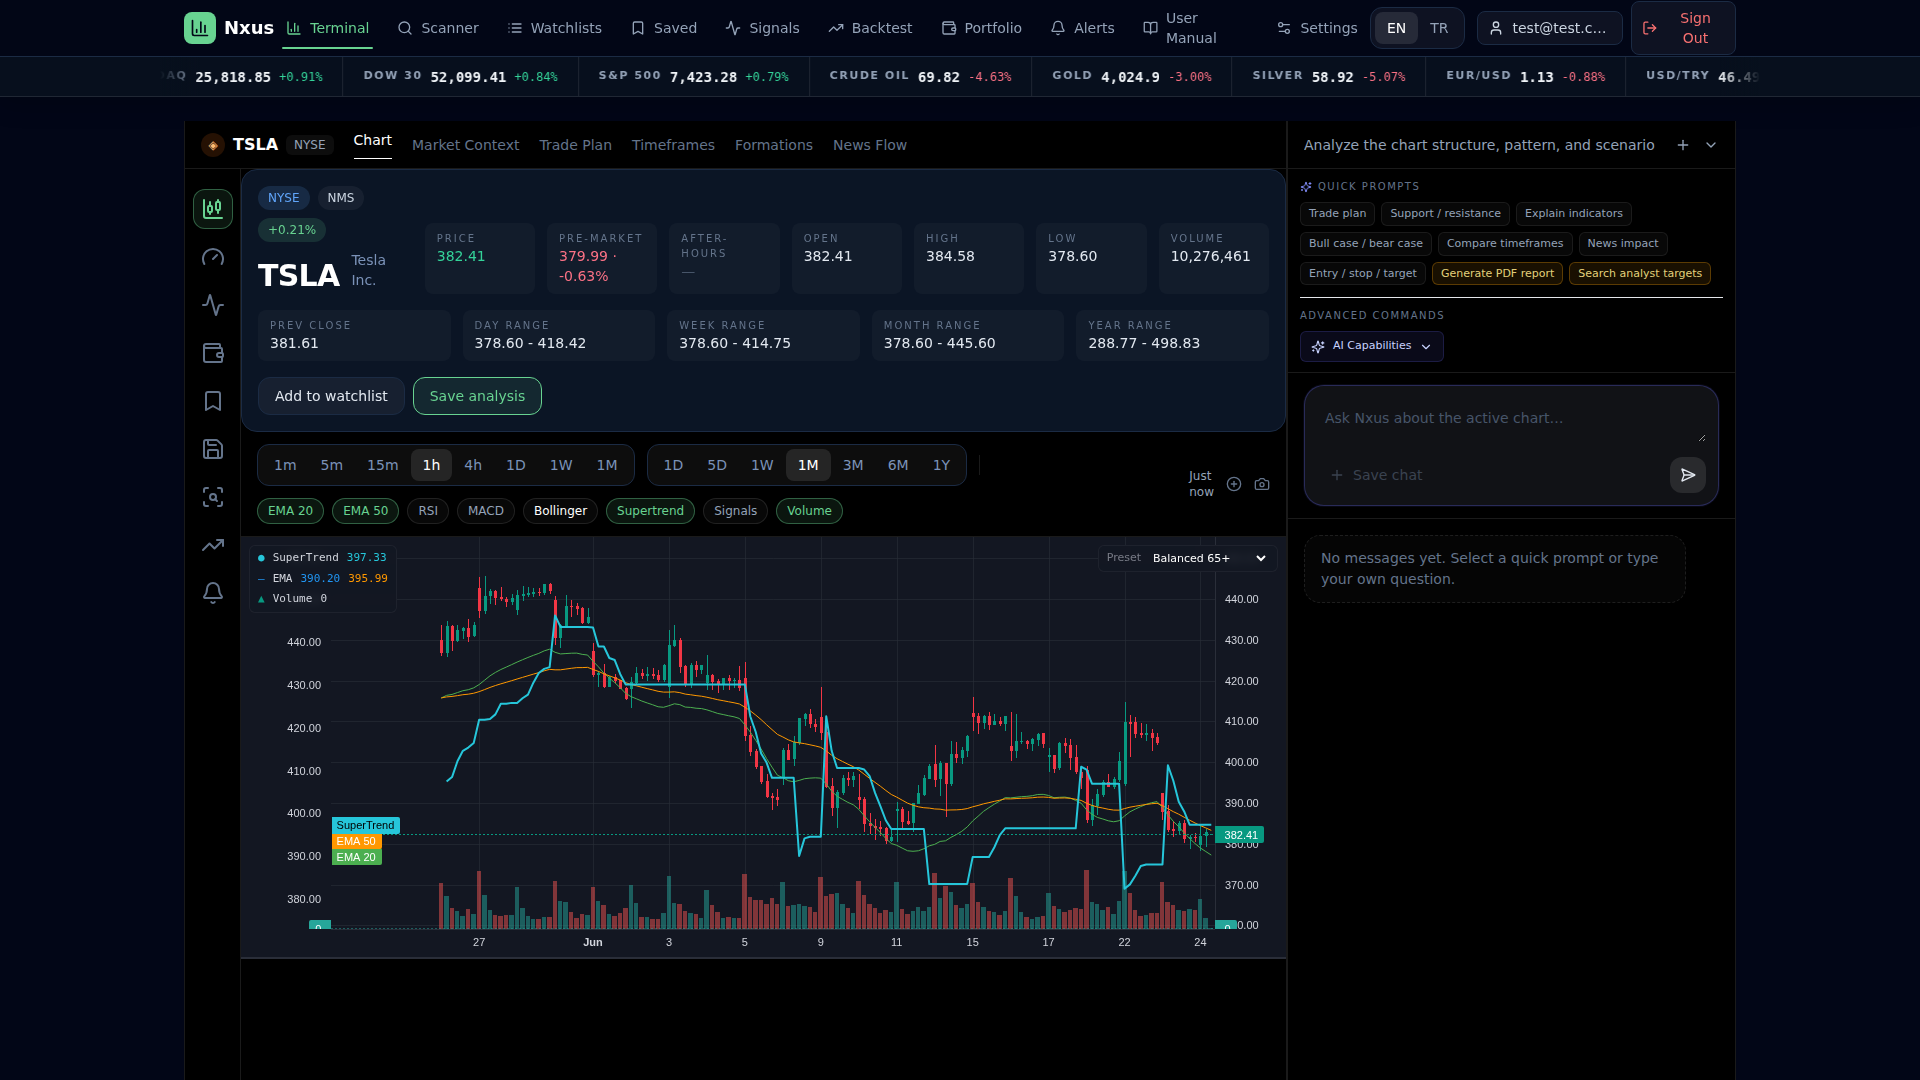
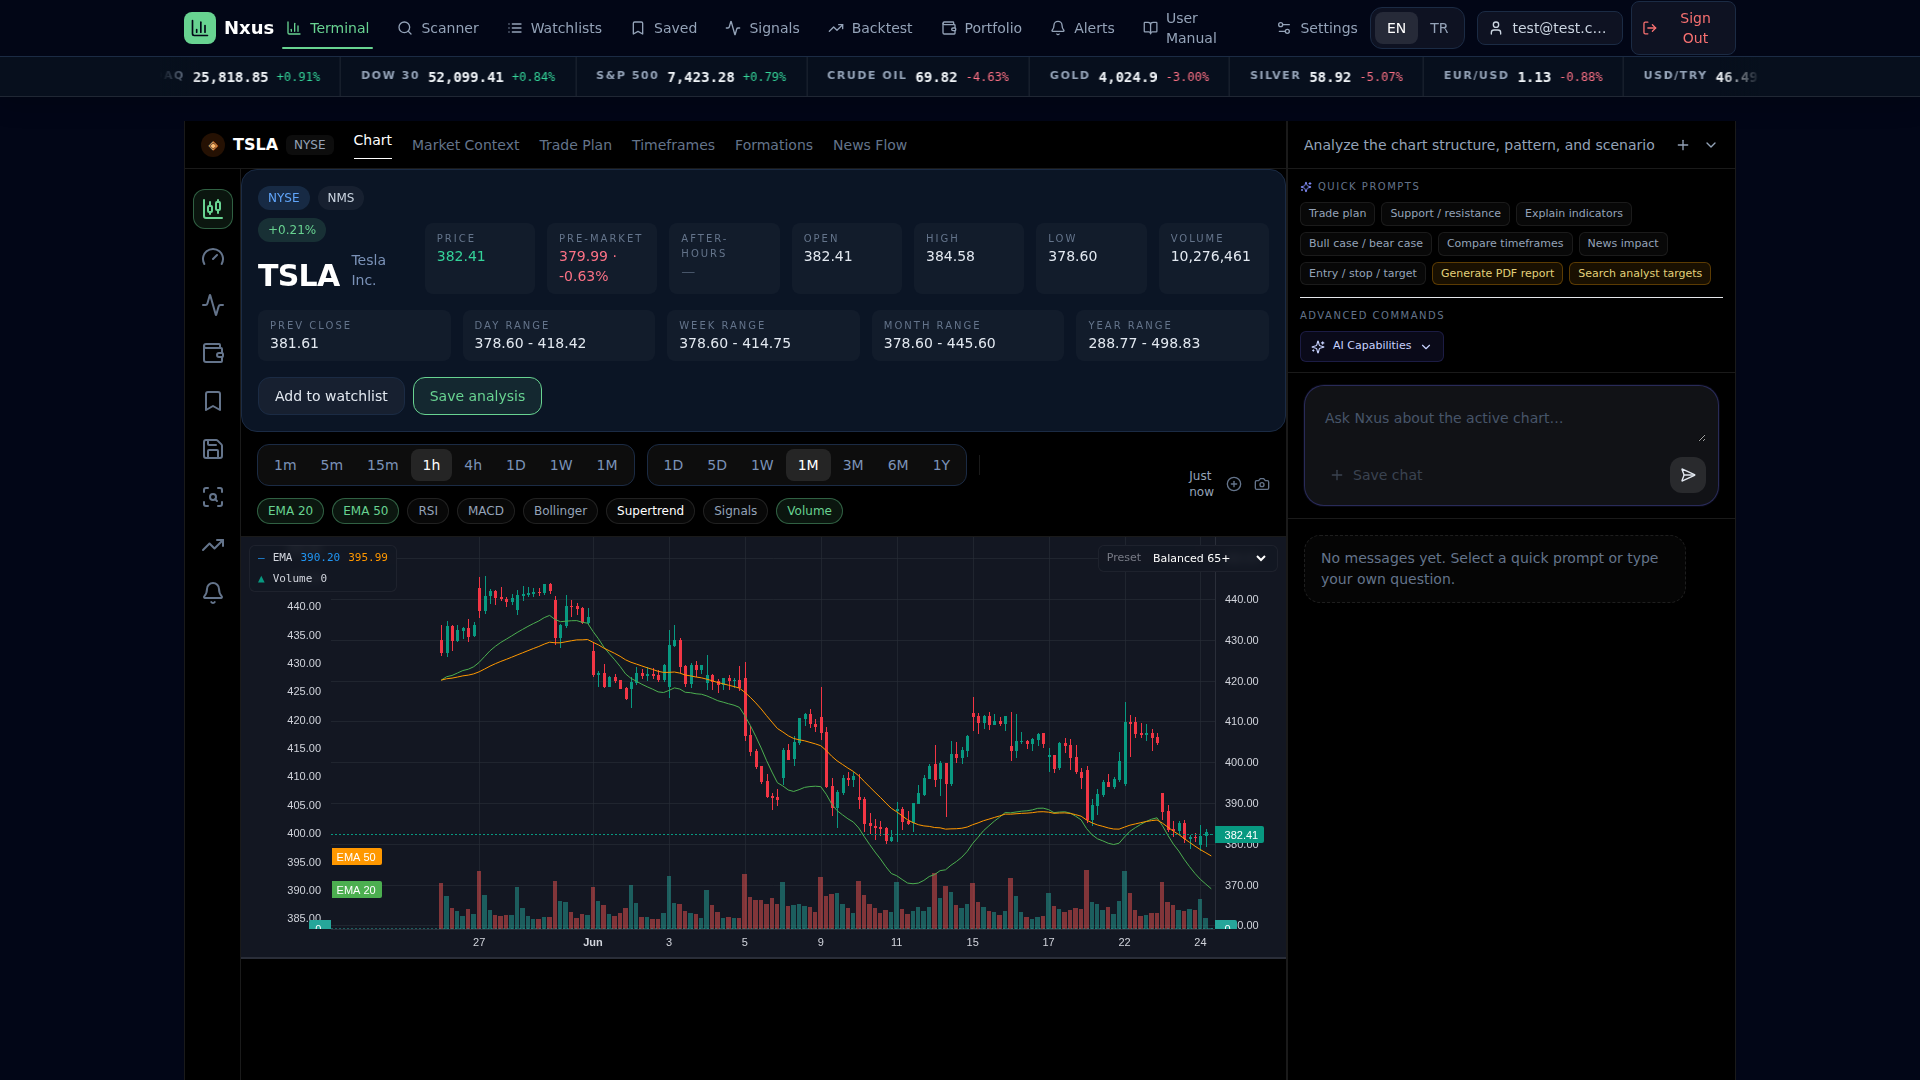
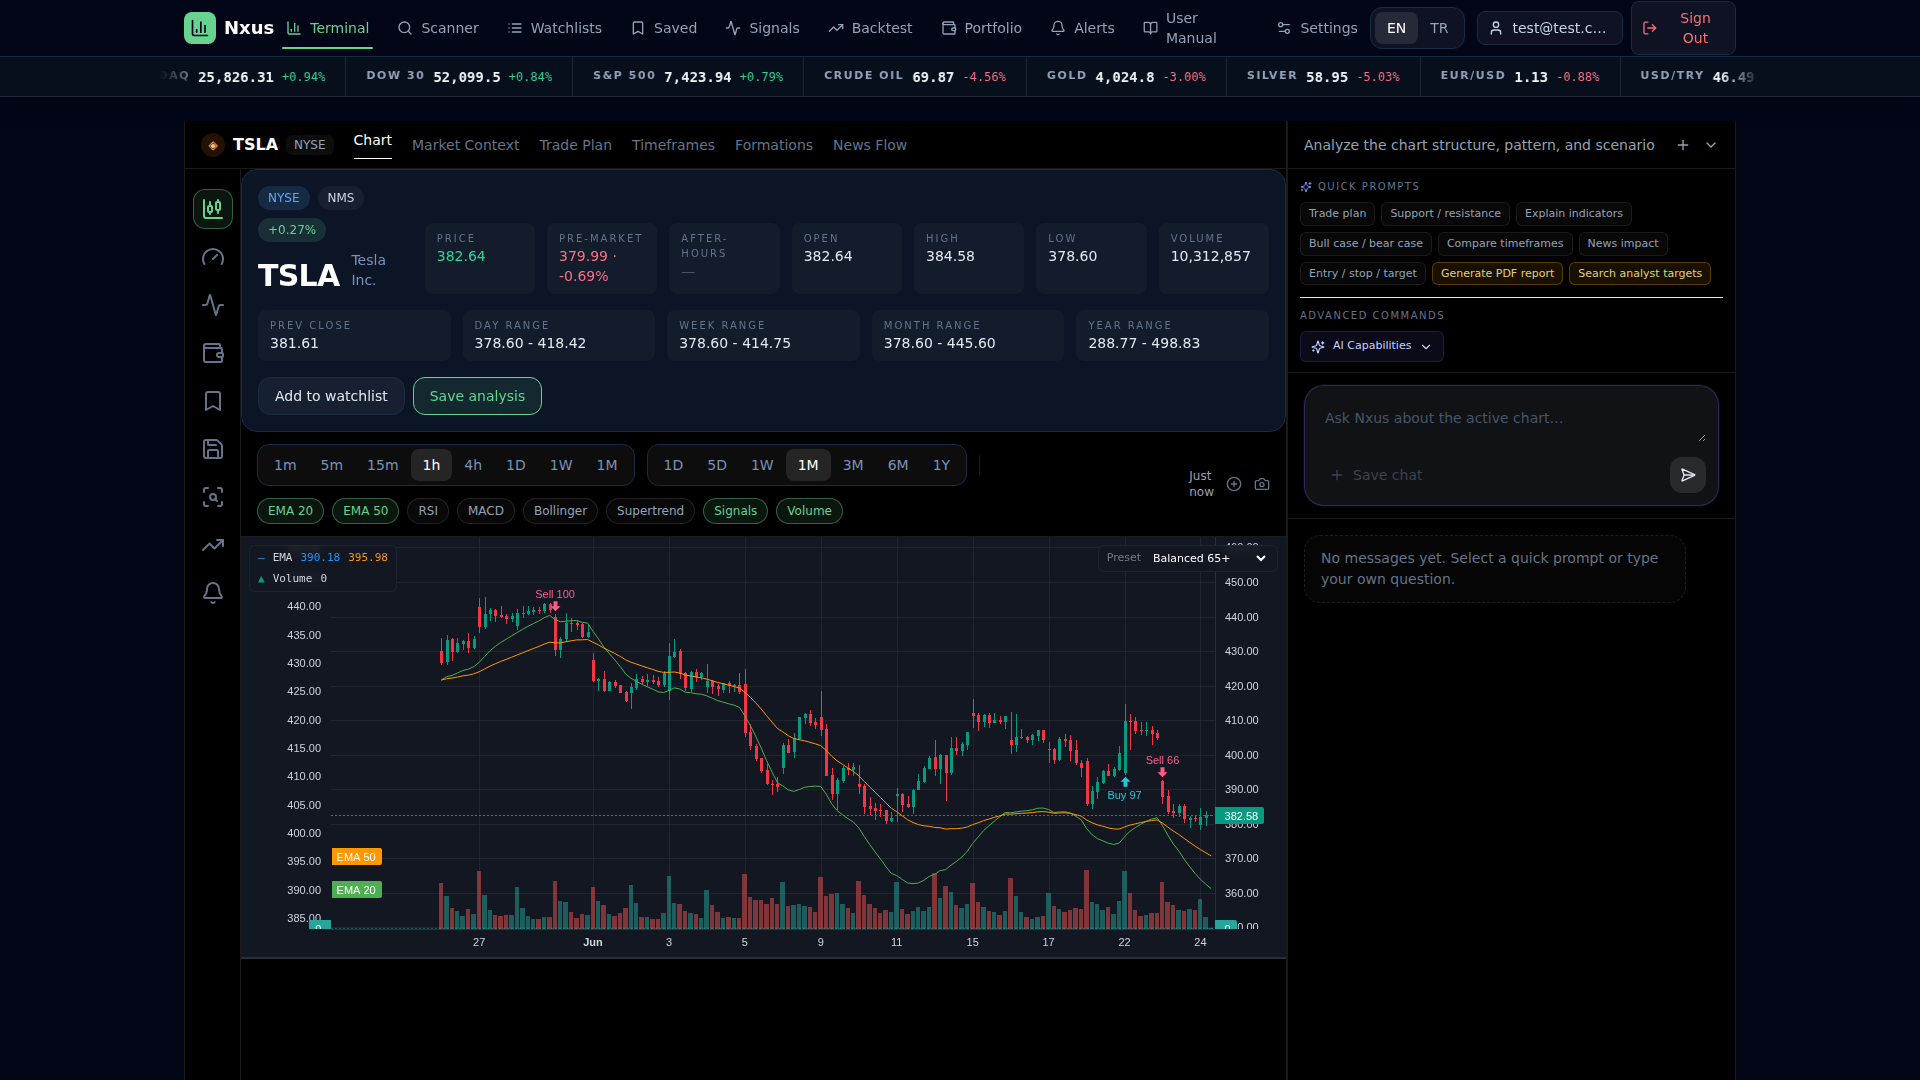
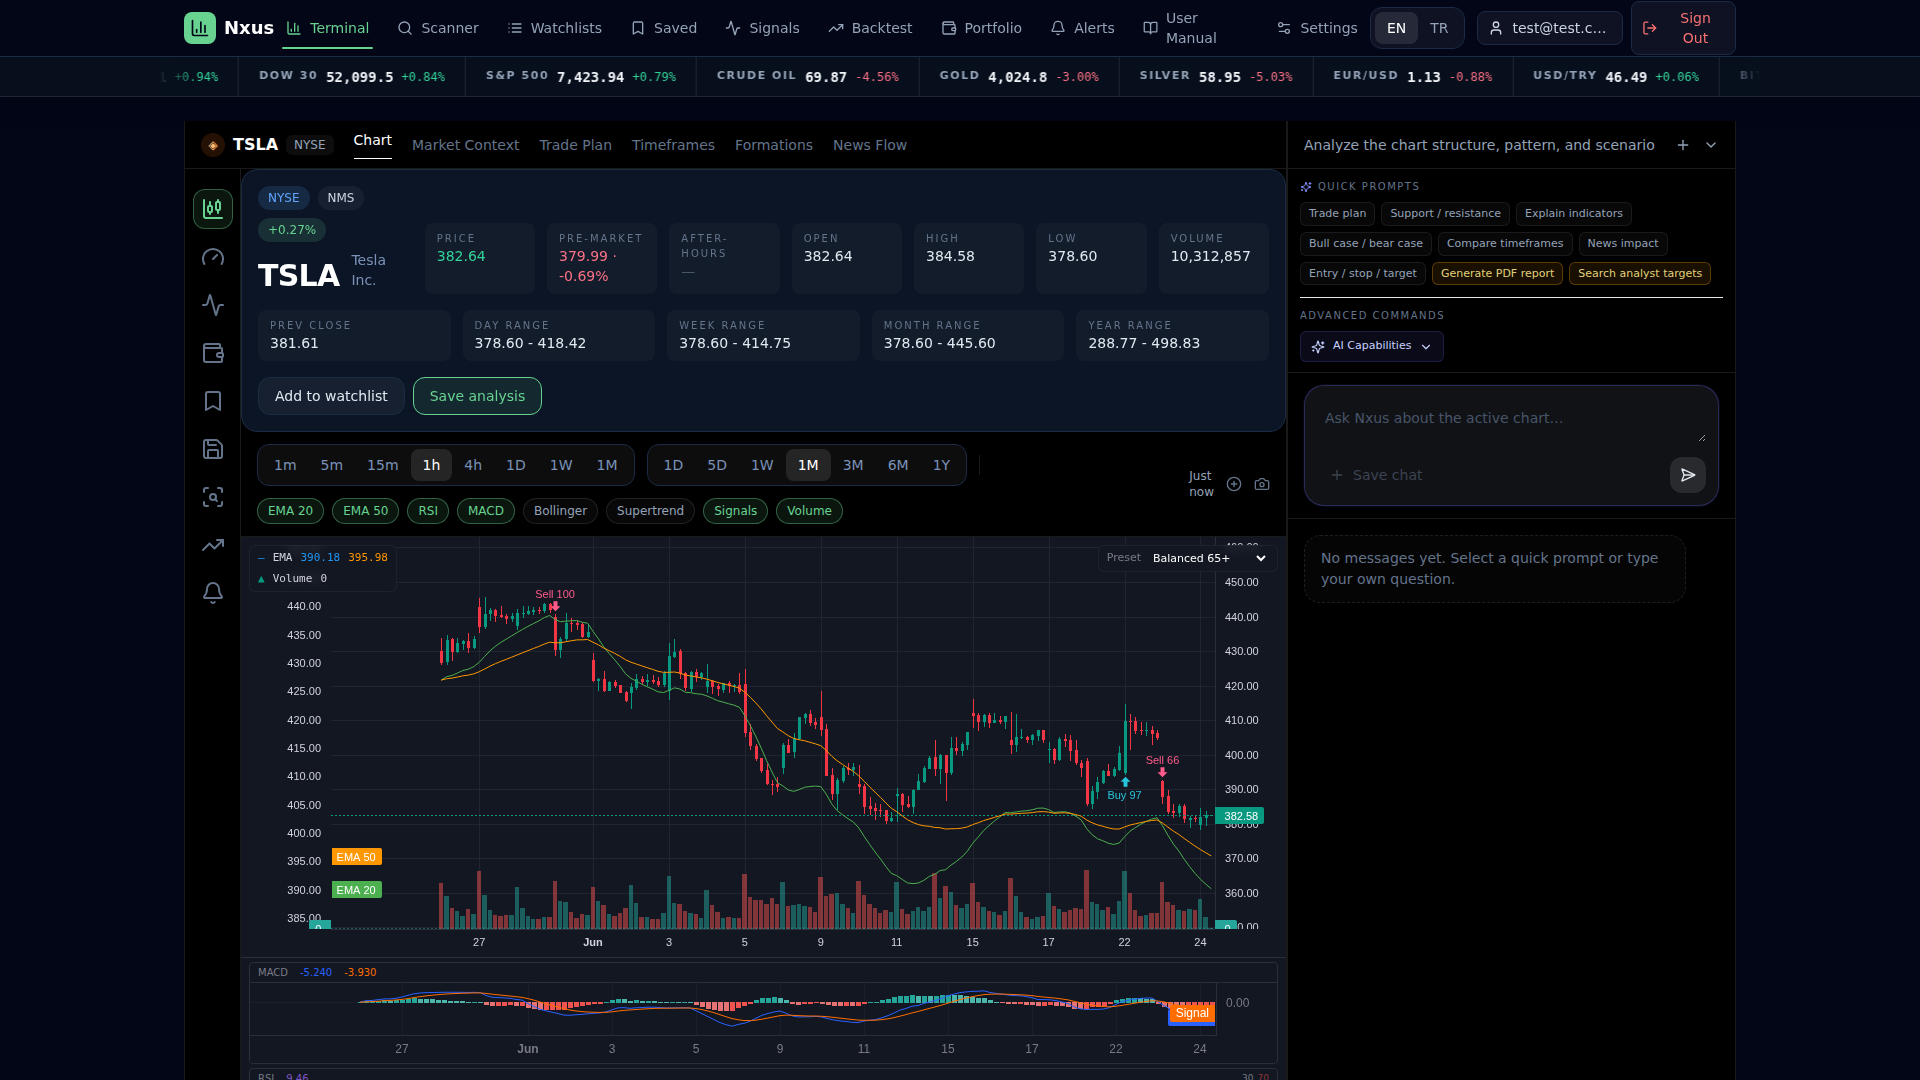
Use the same 1h / 1M context when comparing overlays.
8. Scanner
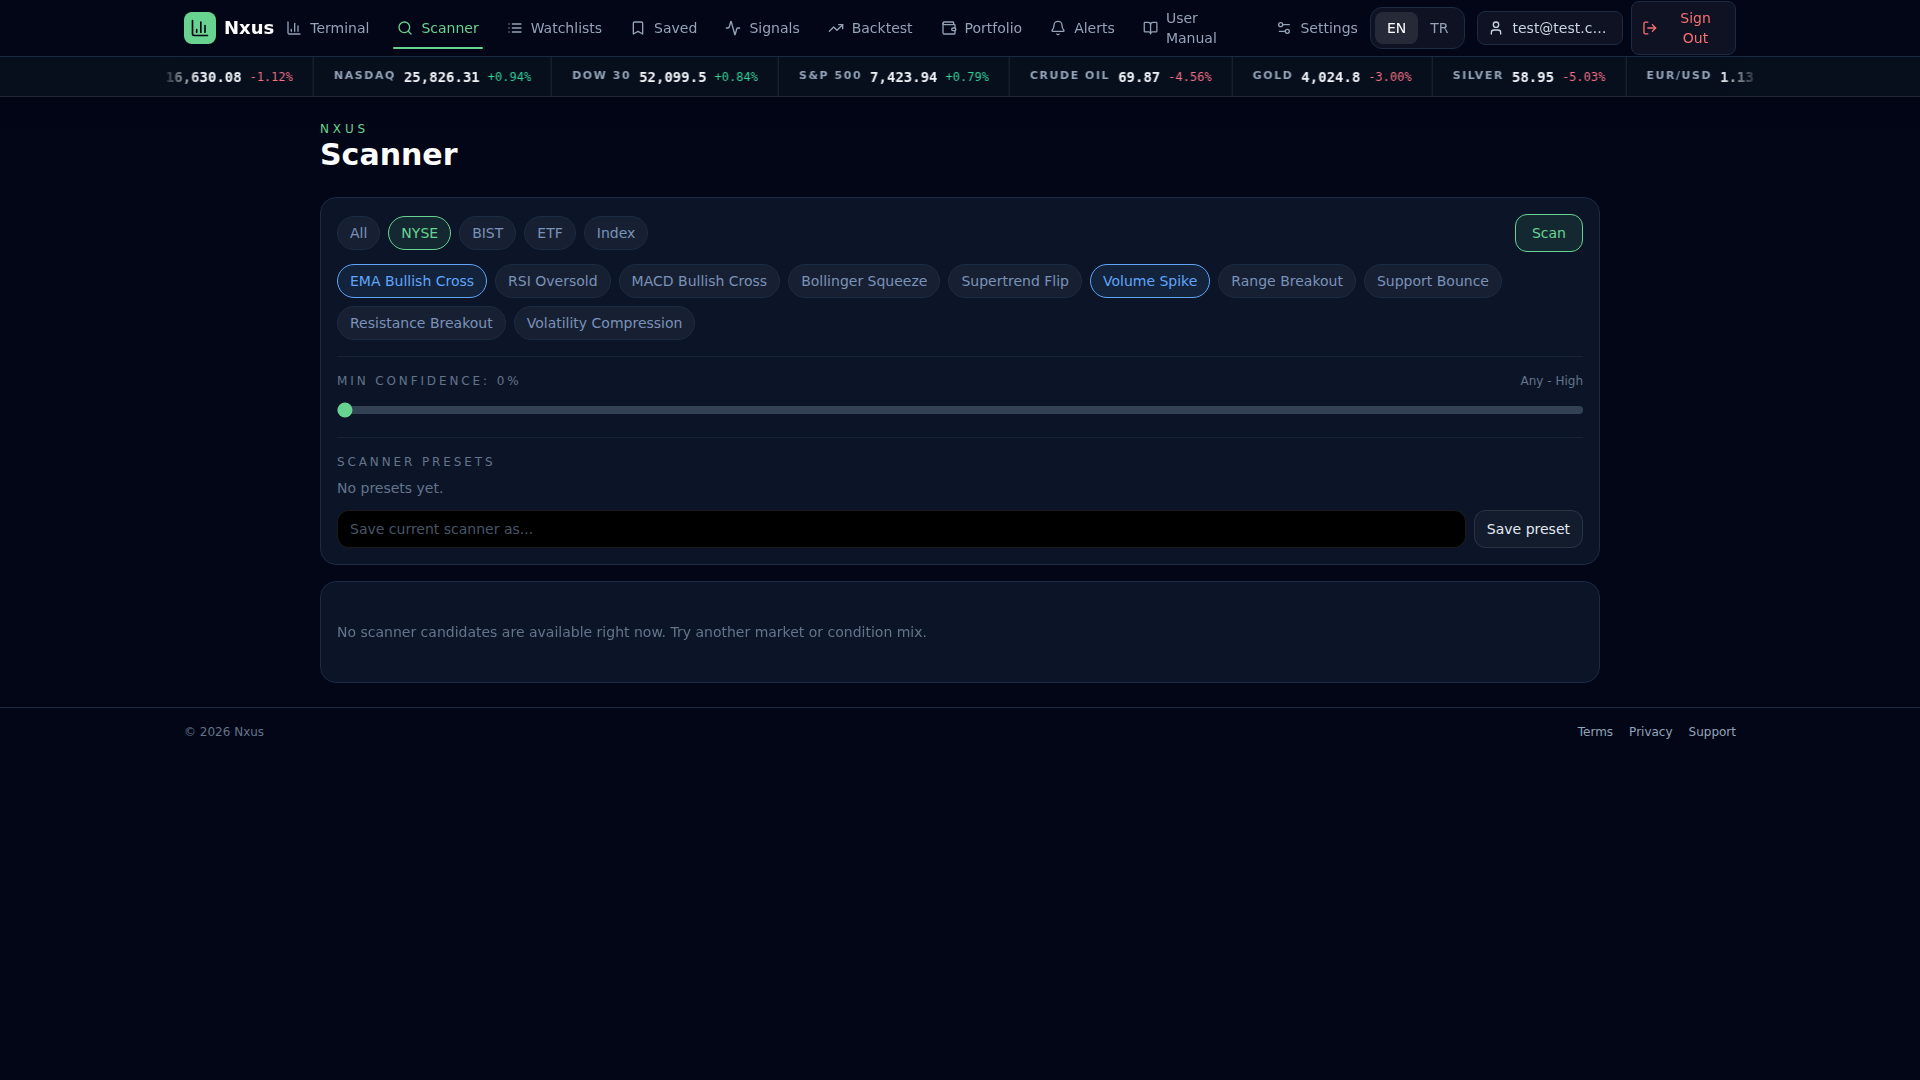
Scanner helps find candidates by market, technical conditions, and available fundamental metrics. BIST presets include gainers, volume, RSI oversold, value, quality, and dividend screens. Users can save, share, and alert on personal screener presets. Missing provider fields remain unavailable rather than being estimated.
To use the Scanner:
- Open Scanner from the navbar.
- Select a market universe (e.g., BIST or US) from the filter bar.
- Choose a preset from the preset buttons, or add individual filters by
clicking a filter category and selecting a metric and condition.
- Adjust the sort field and result limit as needed.
- Click Run to execute the scan. Results appear in the table below.
- Click any symbol in the results to open it in Terminal.
- To save a custom preset, configure your filters and click Save preset.
Saved presets appear alongside built-in presets for quick reuse.
9. Watchlists
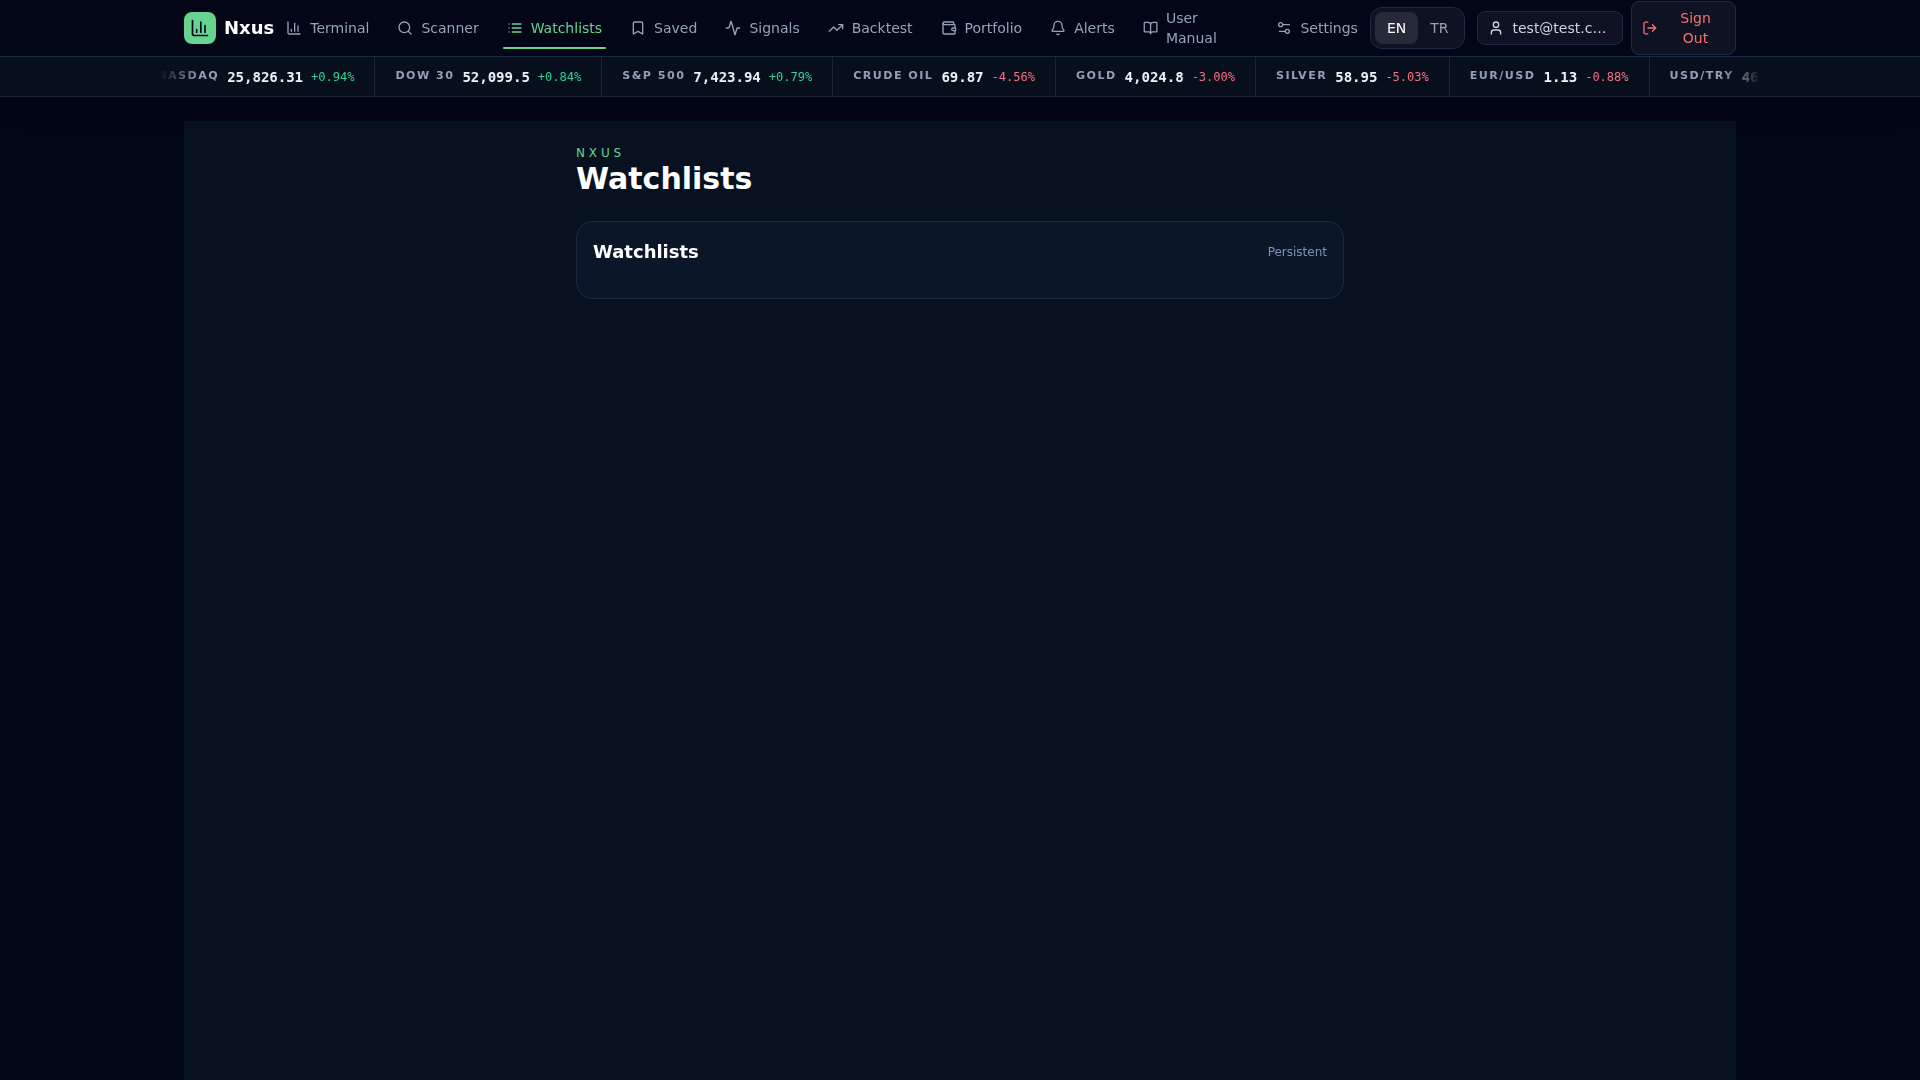
Watchlists keep TSLA and related symbols in persistent lists. Watchlist Intelligence compares price change, P/E, ROE, dividend yield, and the next known event in one table. Optional Telegram notifications can report newly discovered watchlist events.
To add a symbol to a watchlist from Terminal:
- Open Terminal and search for a symbol (e.g., TSLA).
- Click the Add to watchlist button in the workspace header.
- The symbol is added to your default watchlist (named Core Momentum). If that
watchlist does not exist yet, it is created automatically with the symbol included.
To manage watchlists on the Watchlists page:
- Open Watchlists from the navbar.
- To create a new watchlist, use the create control in the sidebar, enter a
name, and confirm.
- To rename a watchlist, select it in the sidebar and use the rename control.
- To remove a symbol from a watchlist, use the remove control next to the
symbol entry.
- To delete a watchlist entirely, use the delete control in the sidebar.
- The Watchlist Intelligence table below shows price change, P/E, ROE, dividend
yield, and the next known event for all symbols across your watchlists.
10. Saved analyses
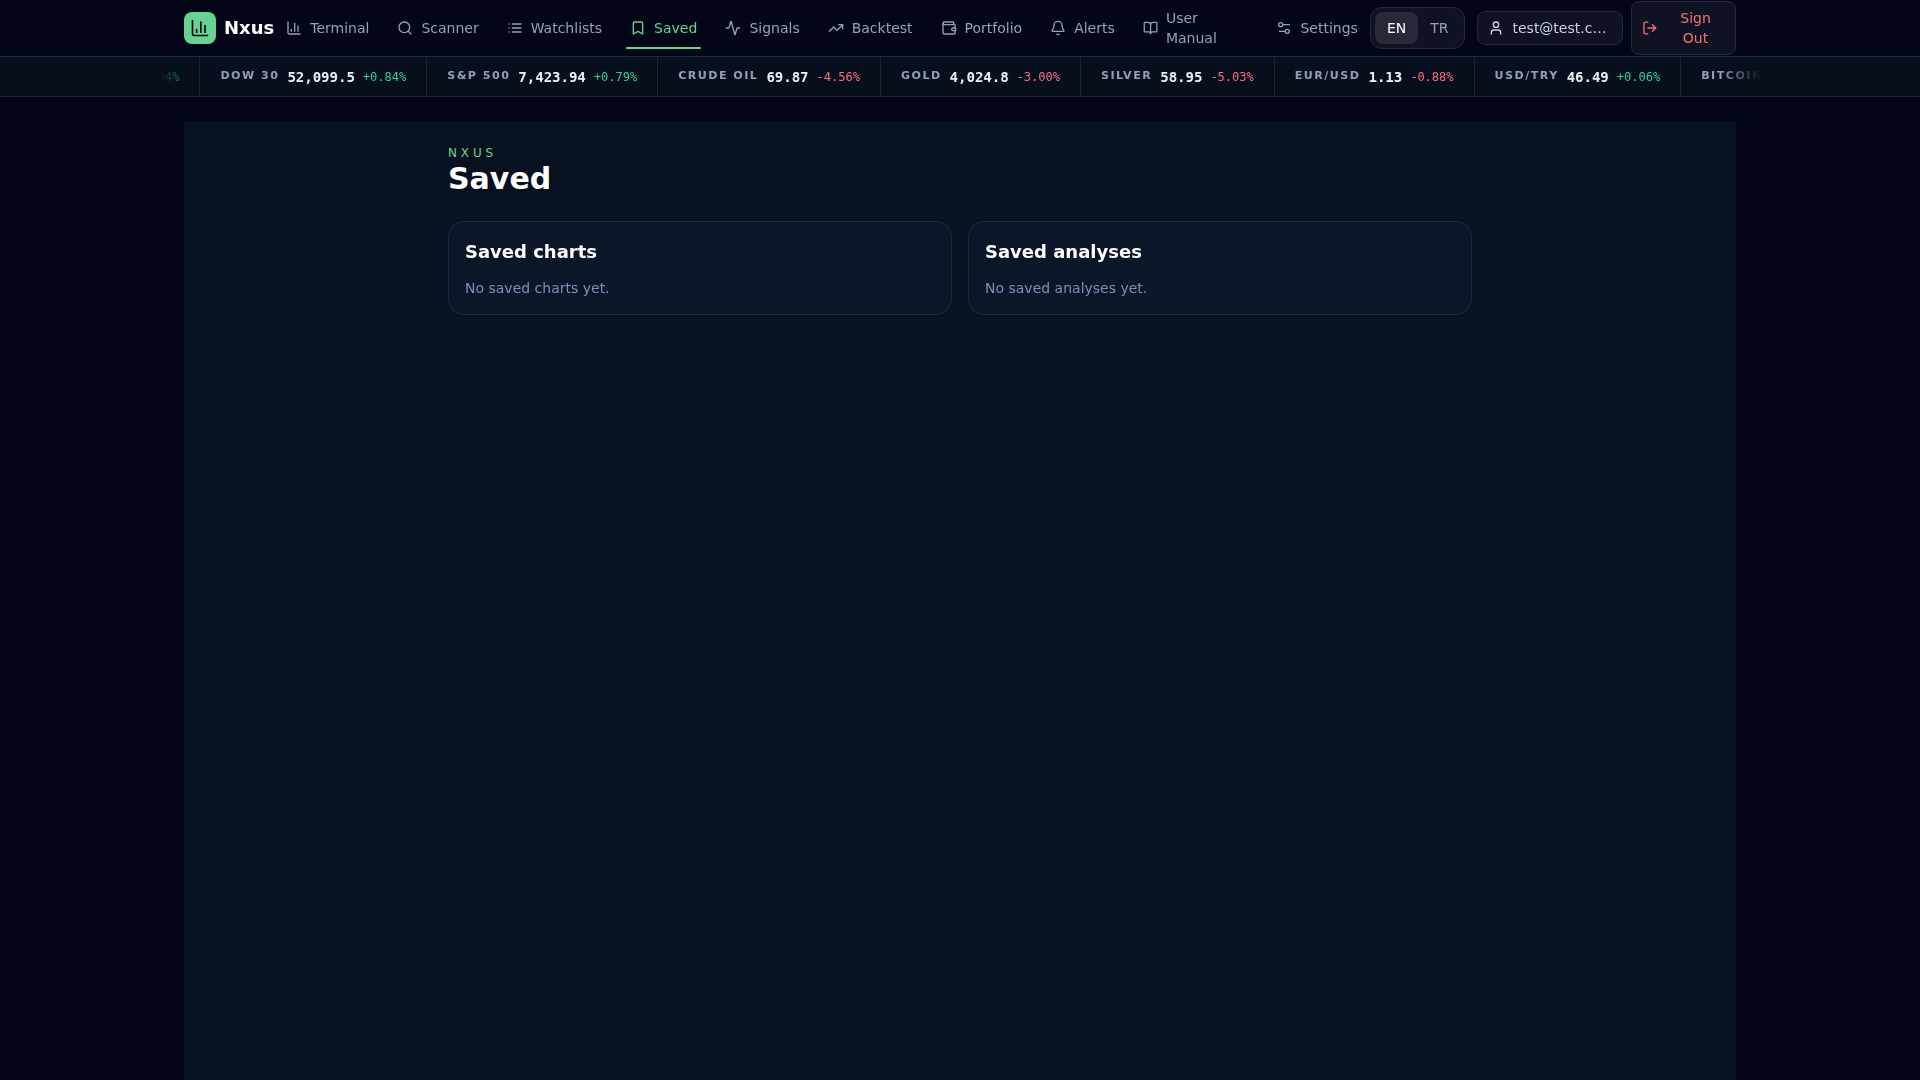
Saved stores charts and AI analyses. After reviewing TSLA, save useful analysis or chat context so it can be reopened later.
11. Signals
Signals shows signal history, filters, outcomes, confidence, engine version, and performance fields. Filter by TSLA to focus on a single instrument.
12. Backtests
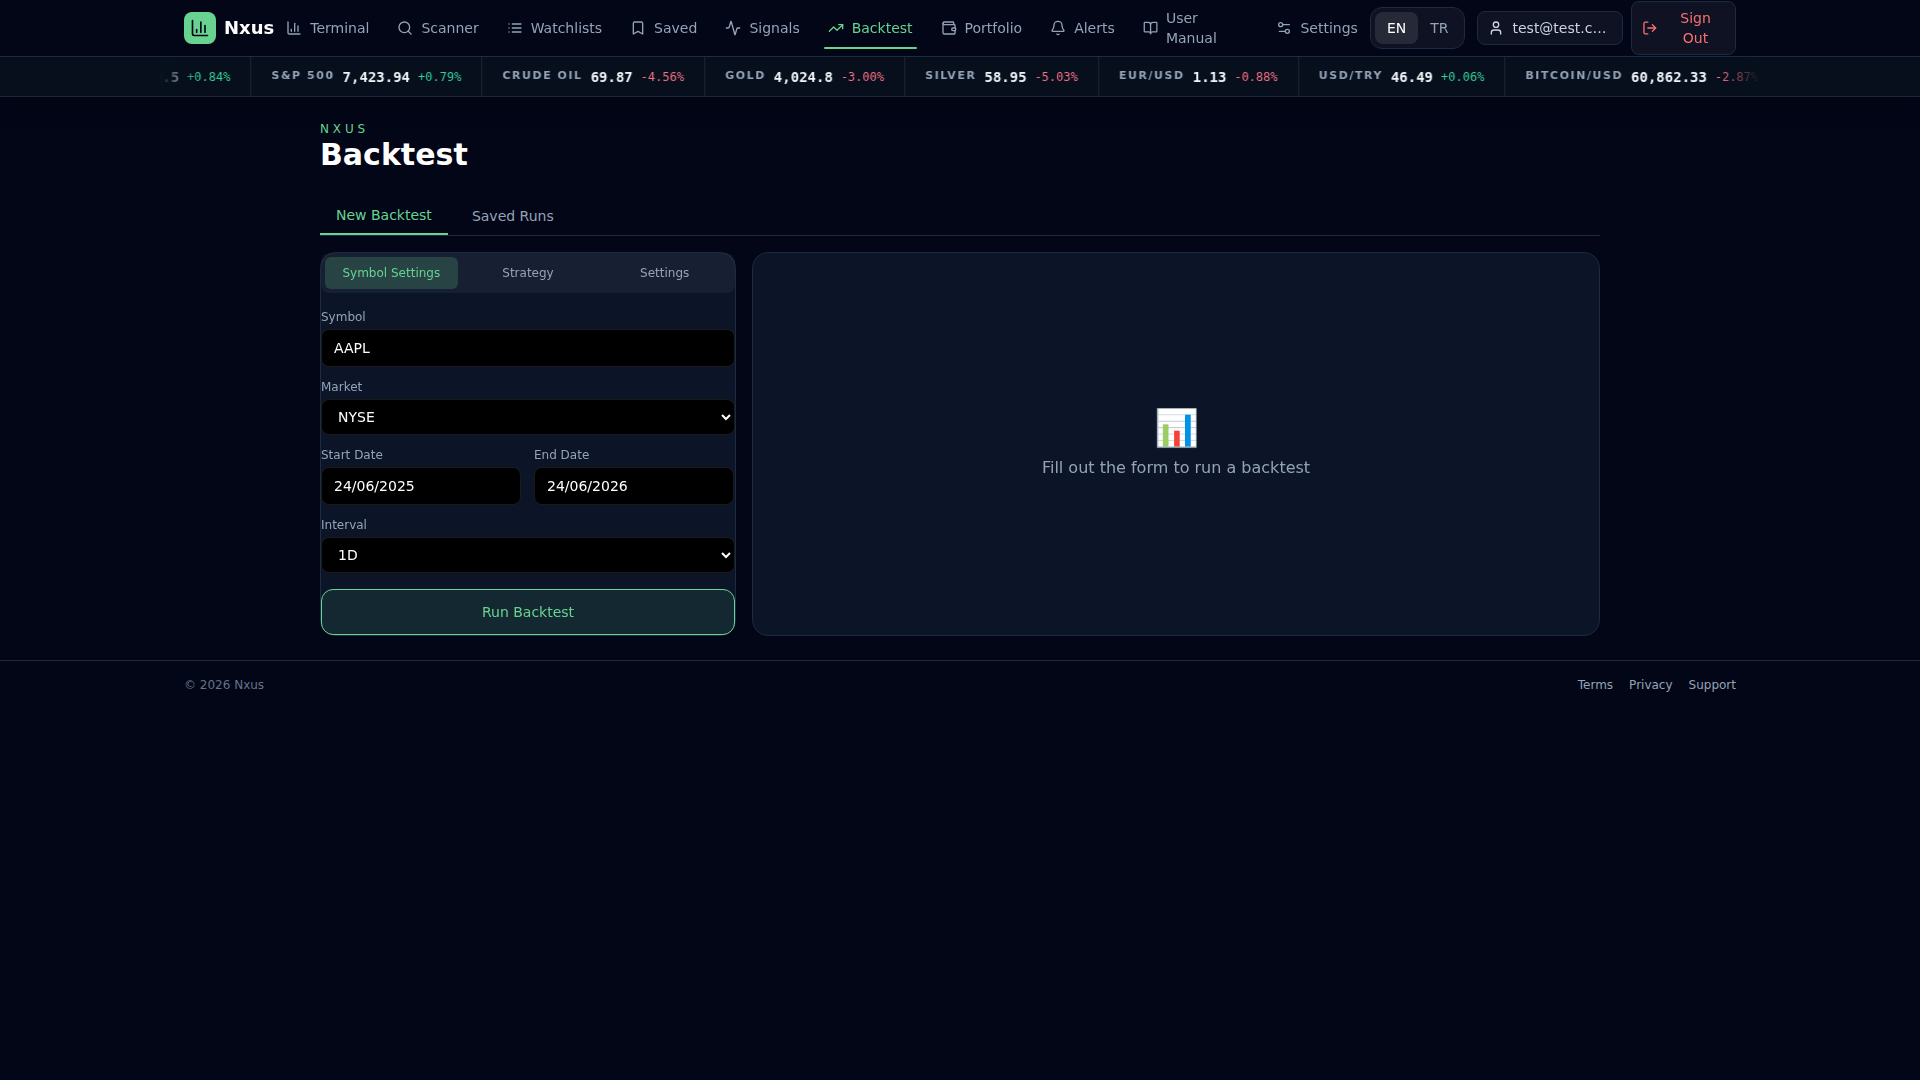
Backtest lets users test strategy assumptions. The screenshot shows a TSLA NYSE backtest form with date range and interval controls.
13. Portfolio
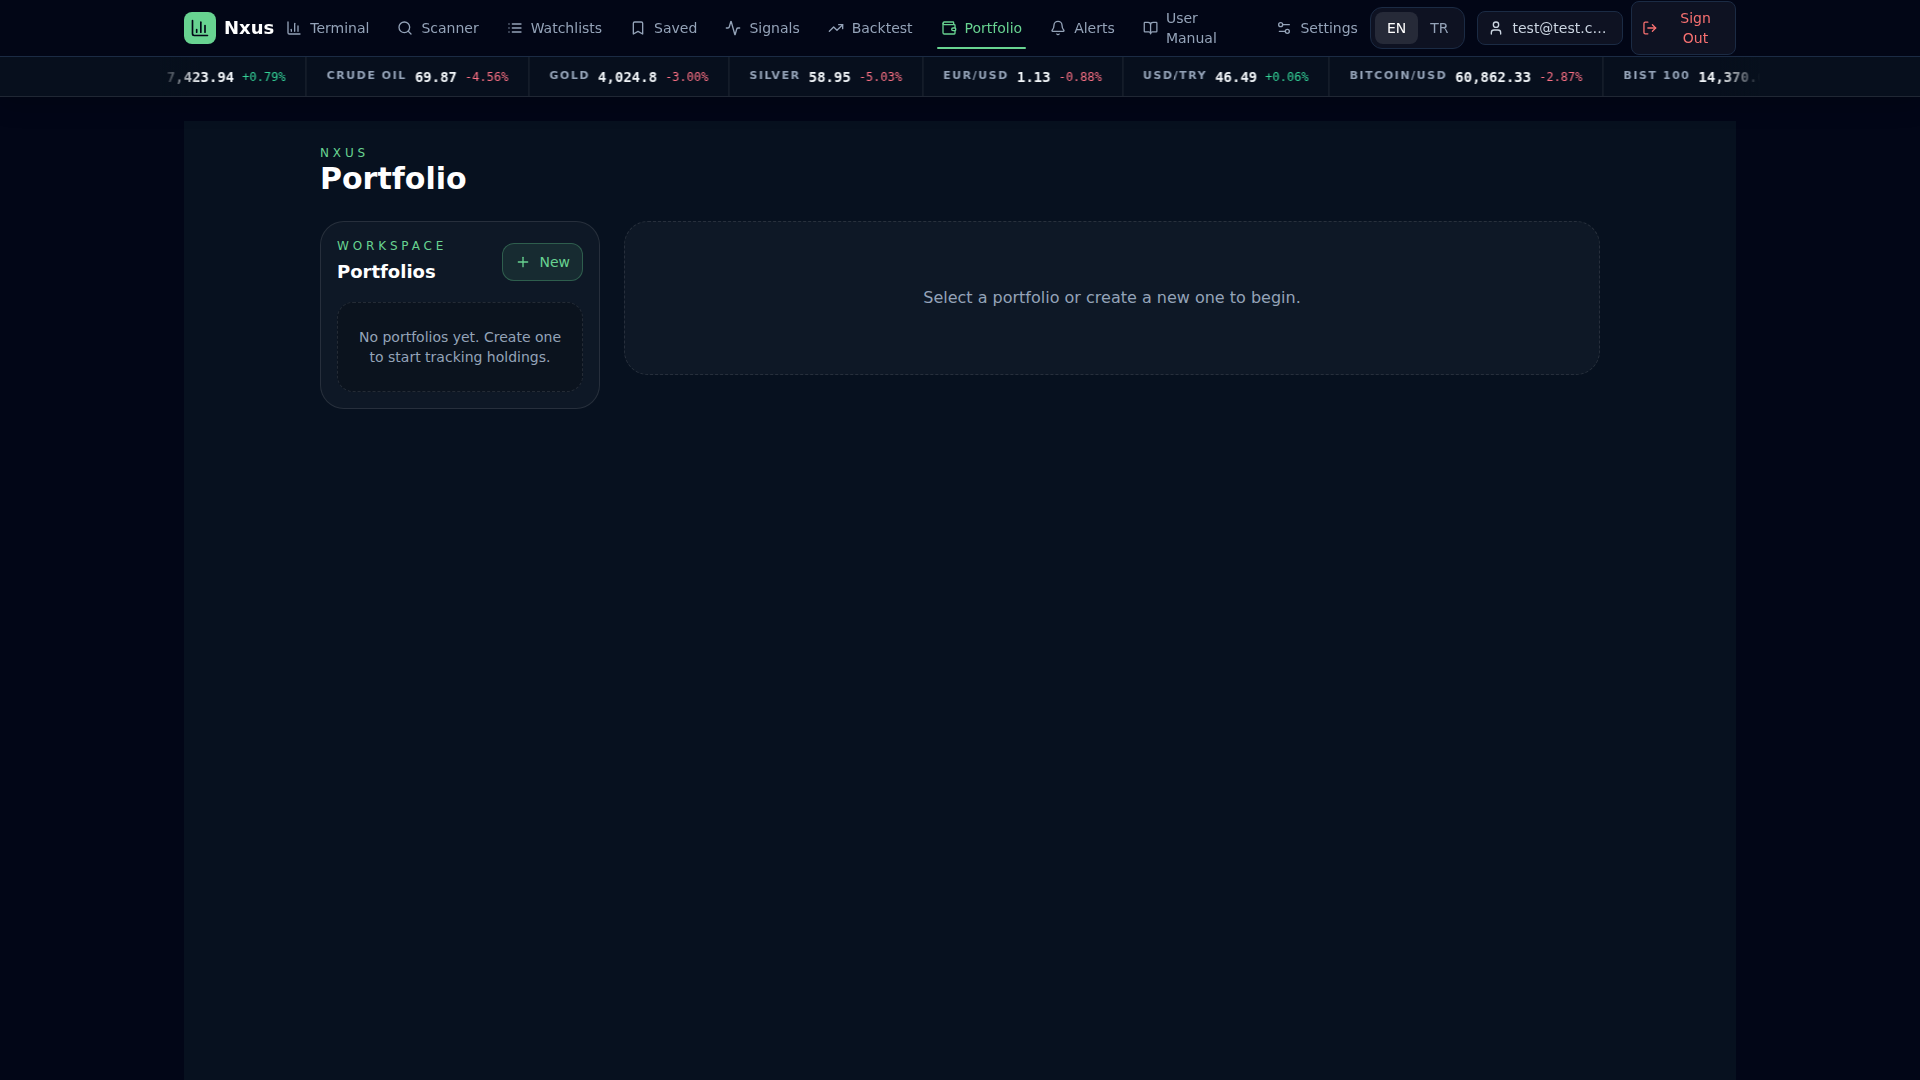
Portfolio tracks holdings and transactions. Create a portfolio, then add TSLA transactions for planning and review.
14. Alerts
Alerts supports price thresholds, corporate-event rules, and saved-screener alerts. Telegram settings provide separate controls for buy/sell signals, price alerts, corporate events, and watchlist events. Alert history and worker status help administrators verify delivery processing.
To create a price alert:
- Open Alerts from the navbar.
- Click the Create Alert button.
- Enter the symbol (e.g., TSLA), select the market, and choose a condition
(above or below a target price).
- Enter the target price.
- Optionally add a note.
- Click Save to create the alert. The alert appears in the alerts list.
To manage alerts:
- Existing alerts are listed with their symbol, condition, target price, and
status (active or inactive).
- Use the toggle control to enable or disable an alert.
- Use the edit control to modify the condition or target price.
- Use the delete control to remove an alert.
Corporate-event alerts are managed on the same Alerts page under the corporate events section. Create an event alert for a specific symbol to receive notifications about corporate actions.
14.1 Financial Health and peers
Open **Fundamentals** in Terminal for valuation, profitability, balance-sheet, shareholder-return, and annual financial-history views. Peer comparison shows a same-sector reference set and lets you add or remove manual comparison symbols. Provider values may be delayed or absent; Nxus displays unavailable fields as missing and never fabricates fundamentals.
15. AI functionality
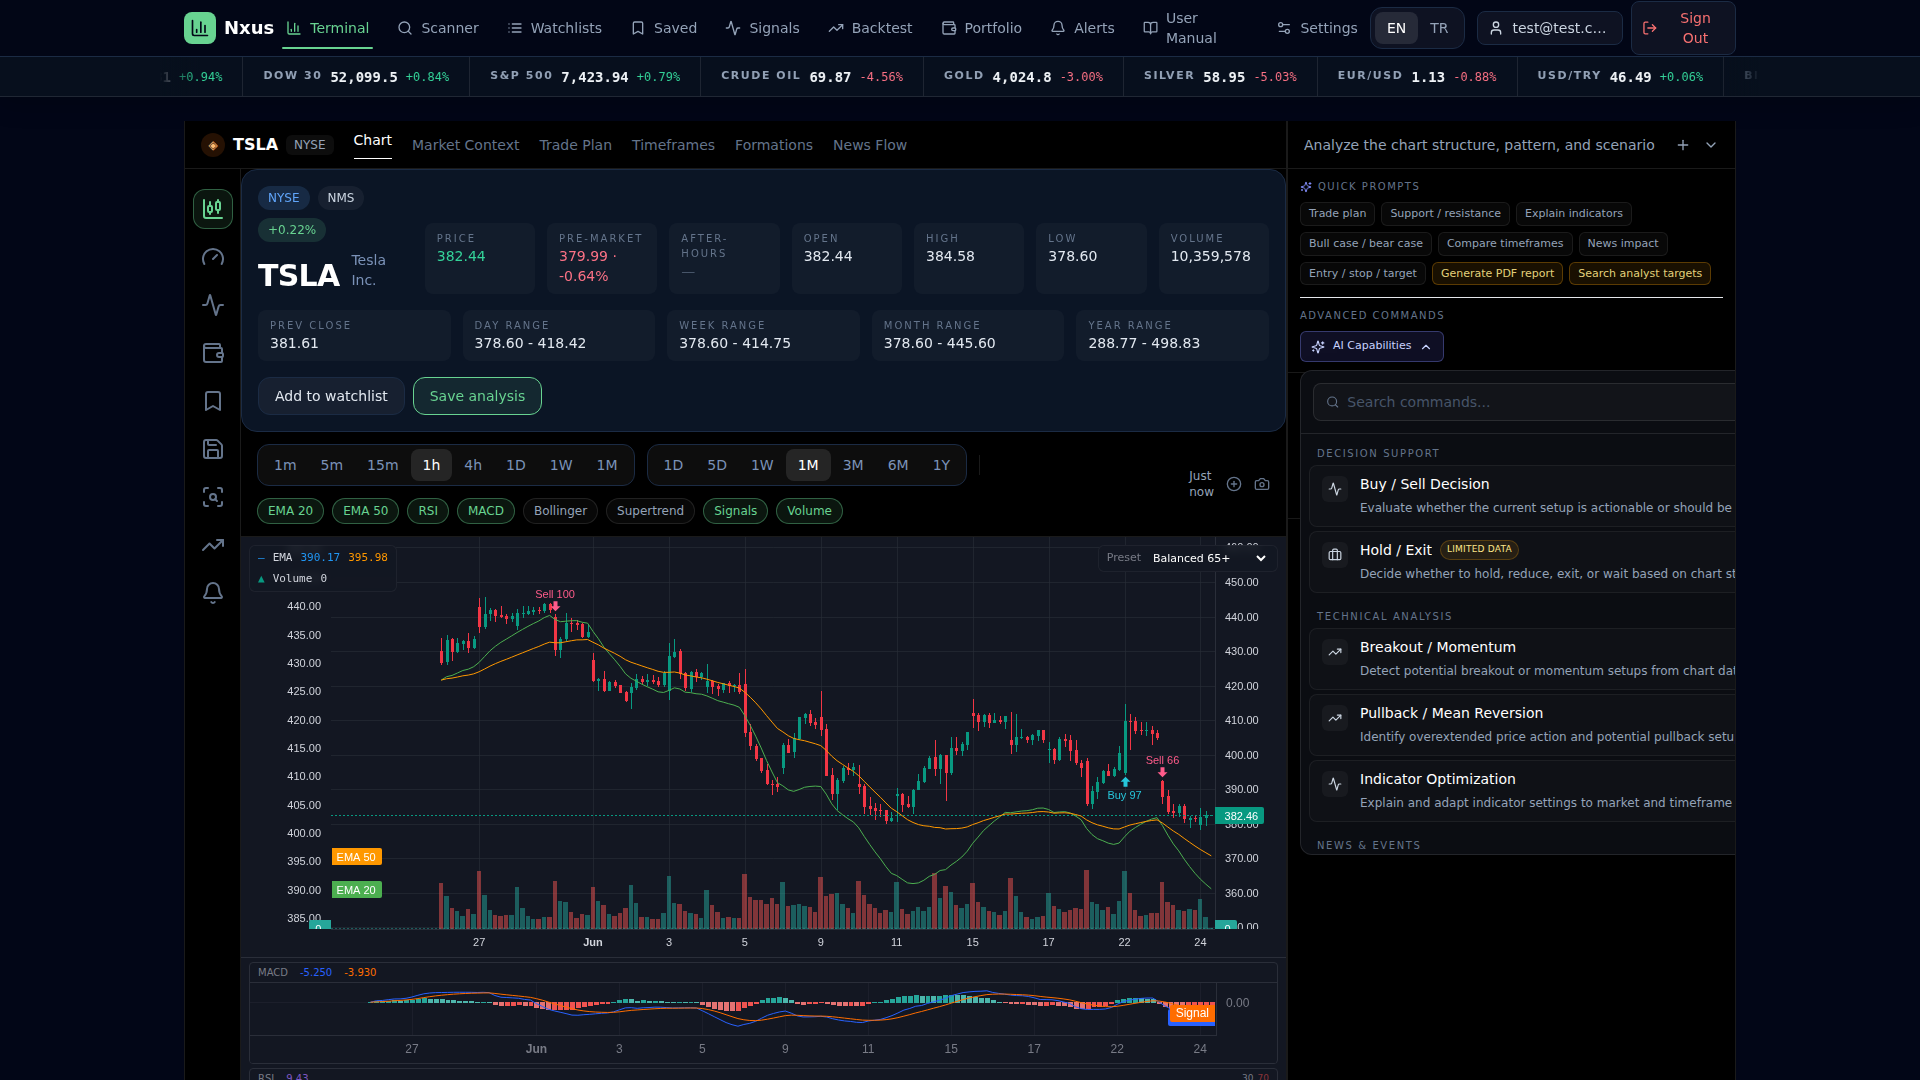
The TSLA workspace includes the Nxus AI panel with quick prompts, advanced capability commands, an input field, and chat-save controls. Ask chart-specific questions such as "Summarize TSLA trend, support/resistance, and risk controls." Treat responses as research support, not financial advice.
16. Settings
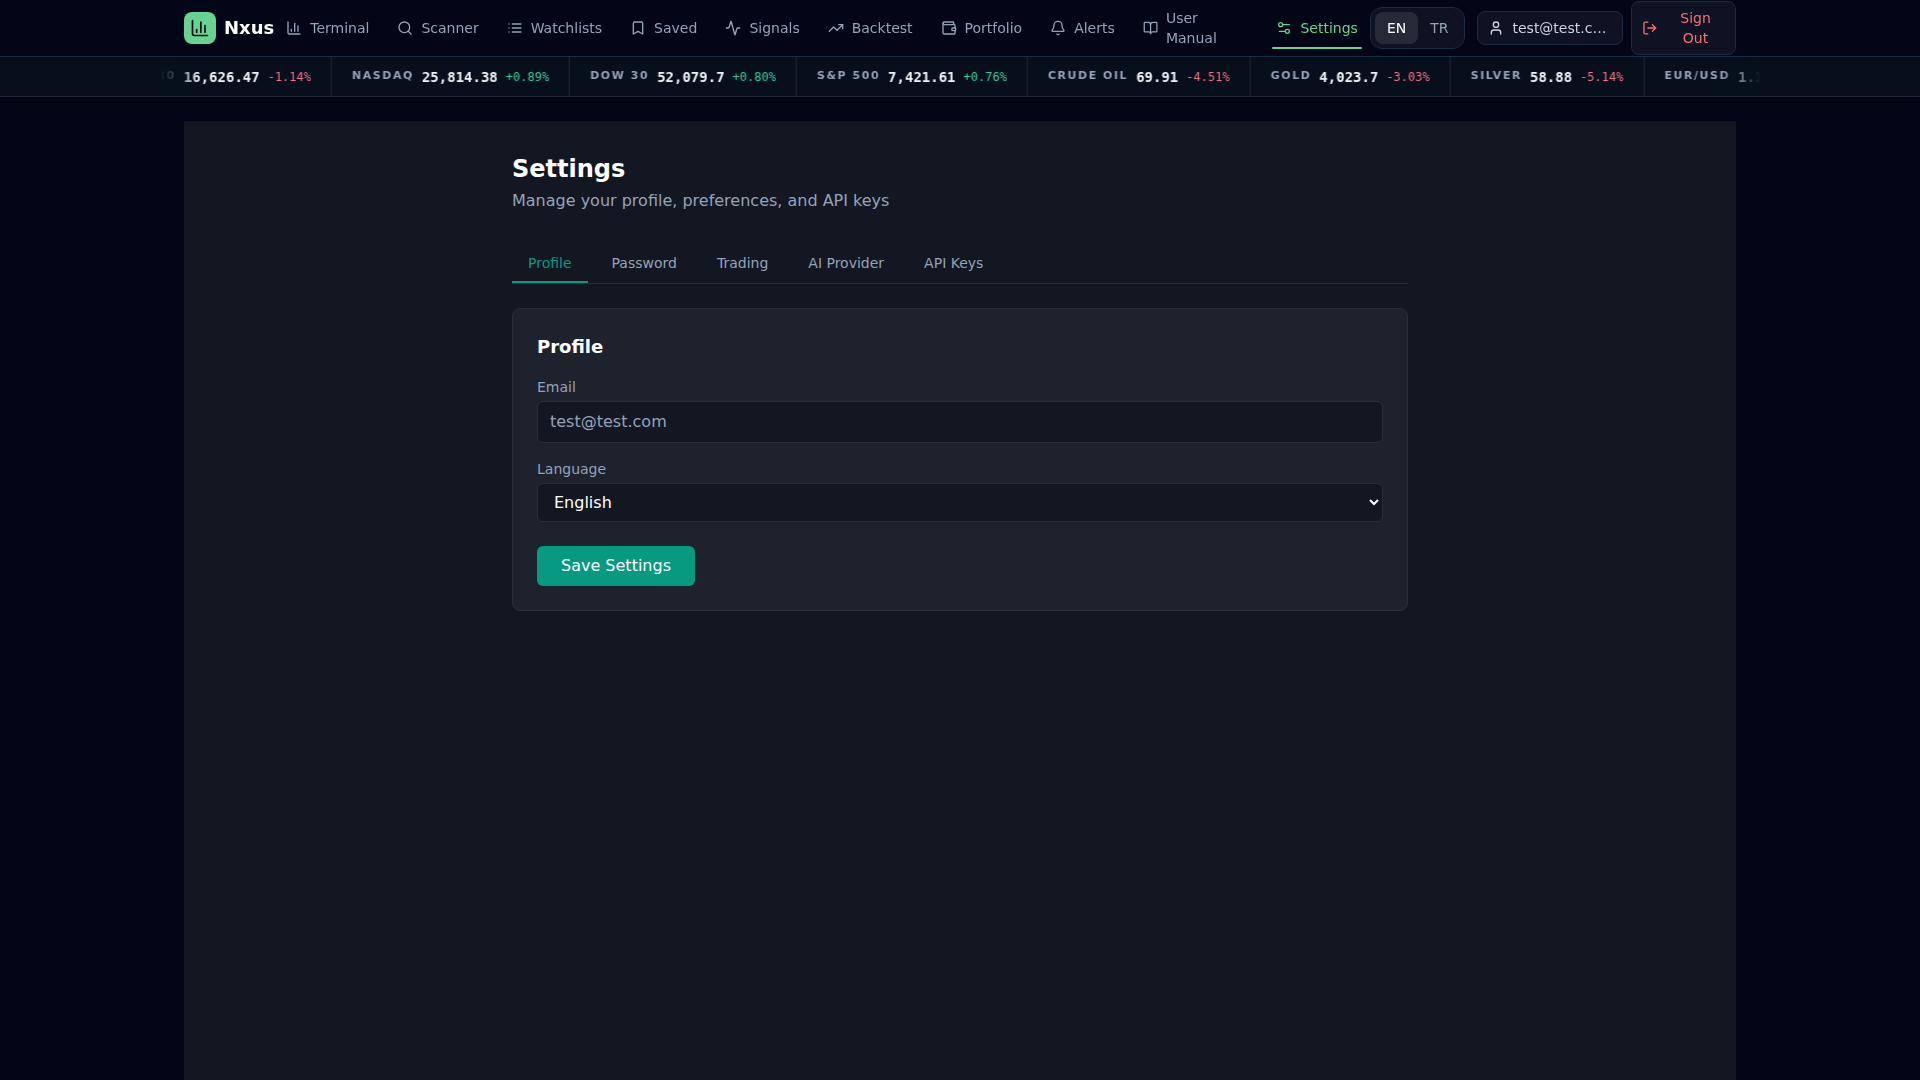
Settings manages profile, language, defaults, AI provider, and API keys. API key values are not included in this public manual.
17. Language selection
Use EN/TR in the navbar. Opening /manuals?language=en shows English; /manuals?language=tr shows Turkish. Navigation links preserve the selected language.
18. Troubleshooting
If a page loads indefinitely, verify sign-in, refresh once, and check /api/health. If AI reports missing configuration, test the provider/API key in Settings. If chart data fails, confirm the symbol, market, interval, timeframe, and authentication state.
19. Signal Performance
Use the Signals page to compare stored outcomes, evaluation horizons, and engine versions. Treat historical accuracy as research context rather than a guarantee of future performance.